Measuring Cold Starts
We are testing cold starts on cloud functions responding to HTTP requests because that’s where the increased latency matters the most.
Each cloud function responds with a simple 200 OK with the following custom response headers:
- Name: Function Name which uniquely identifies its scenario, for instance, saying “Node.js AWS Lambda with a VPC connection”
- Memory: How much memory is provisioned to the function
- Instance ID: A unique identifier of the functions instance that served this request
- Count: The number of requests that this instance already served, including the current one. Count = 1 means the cold start.
We do not rely on execution time reported by a cloud provider. Instead, we measure the end-to-end duration from the client perspective. Thus, the delays in the HTTP gateway (e.g., API Gateway in case of AWS) and network latencies are included in the total duration. The cold start duration is then adjusted by the observed warm response time.
Here is what the setup looks like:
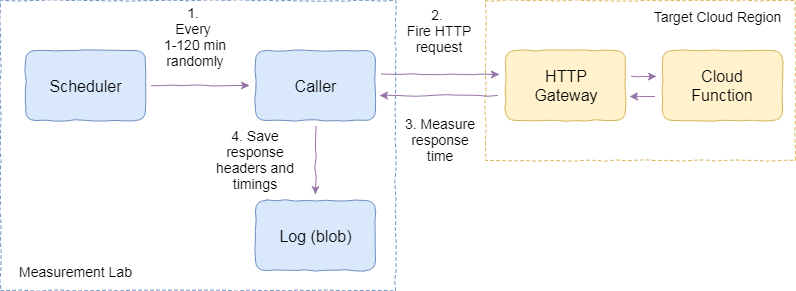
Measuring the cold starts
- There is a scheduler which triggers over random intervals in a given range to see how interval impacts the cold starts.
- The scheduler invokes the caller. The caller sends an HTTP request to the cloud function. The request goes through the HTTP front-end of the cloud and reaches the function.
- The caller measures the time it takes to get the HTTP response back. That’s the key metric for the cold start estimation.
- The caller logs the response and the timings to blob storage.
Given enough number and variety of requests, statistical estimates can be derived from the measurements. The charts and conclusions are based on these estimates.
Learn the results: Comparison of Cold Starts across AWS, Azure, and GCP.