Choosing the Number of Shards in Temporal History Service
Today, I’m diving into the topic of tuning your Temporal clusters for optimal performance. More specifically, I will be discussing the single configuration option: the number of History service shards. Through a series of experiments, I’ll explain how a low number of shards can lead to contention, while a large number can cause excessive resource consumption.
All the experimental data is collected with Maru—the open-source Temporal load simulator and benchmarking tool.
Let’s start with a hypothetical scenario that illustrates the struggle of a misconfigured Temporal cluster.
Symptom: Contention in History Service
Imagine you are benchmarking your Temporal deployment. You are not entirely happy with the throughput yet, so you look into performance metrics. Storage utilization seems relatively low, and storage latency is excellent. CPU usage of Temporal services is low too. Where is the bottleneck?
You start looking at response times and notice that the History service has high latency. Why is that the case? If the storage latency is good, what is the History service waiting for?
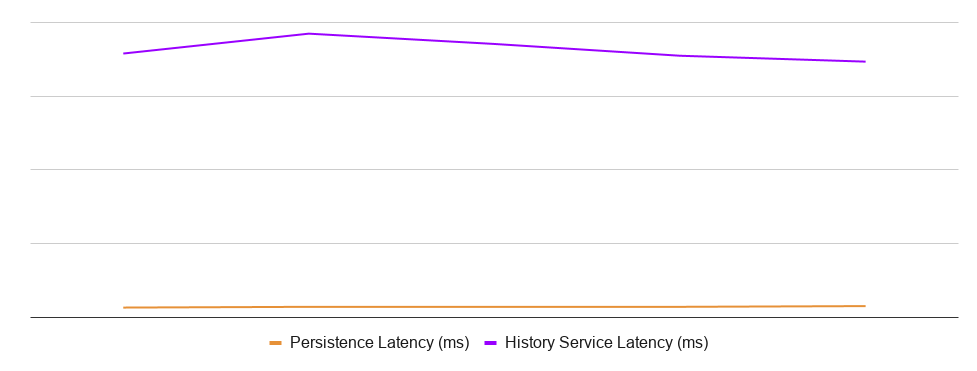
Example of a problematic latency pattern
If the latencies in your system look somewhat like the picture above, your cluster is probably not configured appropriately for the current workload. You are likely in a situation of lock contention due to an insufficient number of History shards.
Theory: History Shards
Temporal provides high guarantees around Workflow consistency. To achieve this goal, Temporal allocates a single host of the History service to process all events of a given Workflow execution.
Each Workflow execution receives a unique identifier. Temporal calculates a hash for each identifier and allocates it to a specific shard based on the hash value. A shard is represented as a number from 1 to N. Executions with the same shard value are processed by the same host.
The History service has a configuration value numHistoryShards to define the total number of shards, set once and forever. Each instance of the History service obtains a lock on multiple shards and starts processing Workflow executions that belong to them.
Shards are logically independent and isolated from each other. To achieve the consistency requirements with Cassandra, Temporal serializes all updates belonging to the same shard.
Therefore, a shard is a unit of parallelism. Since each shard executes all updates under a single lock, all updates are sequential. The maximum theoretical throughput of a single shard is limited by the latency of a database operation. For example, if a single database update takes 10 ms, then a single shard can do a maximum of 100 updates per second. If you try to push more updates, you will see the History service latencies go up without database latency going up. Precisely the case illustrated in the chart above!
Experiment: Observe History Service Contention
Let’s design an experiment to illustrate the impact of the number of History shards on cluster throughput and latency. I created a test Kubernetes cluster with three node pools: one for Cassandra, one for Elasticsearch, and one for Temporal services and workers. I deployed the datastores and Temporal cluster. For the sake of simplicity, every Temporal service has just one pod.
Then, using Maru, I run a benchmark of 25,000 workflow executions to collect metrics around processing speed, response latency, and resource utilization. I conduct the same experiment several times but tweak just one configuration parameter: the number of History service shards.
Single Shard
Let’s start with a base case of just a single shard. All Workflow executions are assigned to the same shard and have to be serialized. As expected, the system throughput is quite limited, and it takes 28 minutes to complete the scenario:
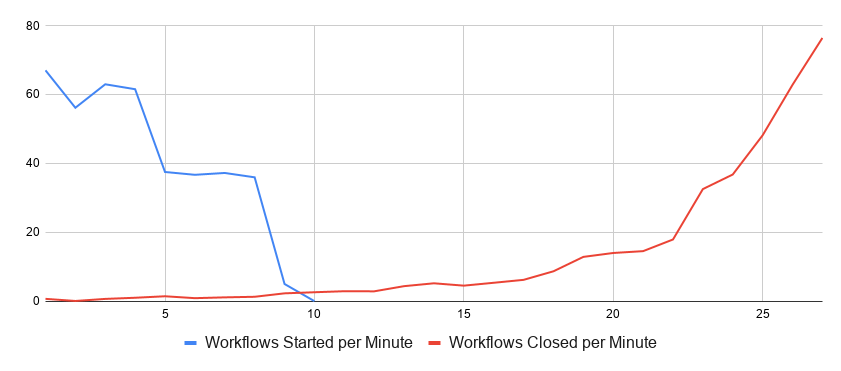
Workflow processing rates for a single-shard configuration
Due to the interference of read and write operations, the processing rate starts really low but goes up as the backlog decreases. This behavior makes sense for the high-contention scenario.
Here is the latency chart of the History service versus the underlying Cassandra database:
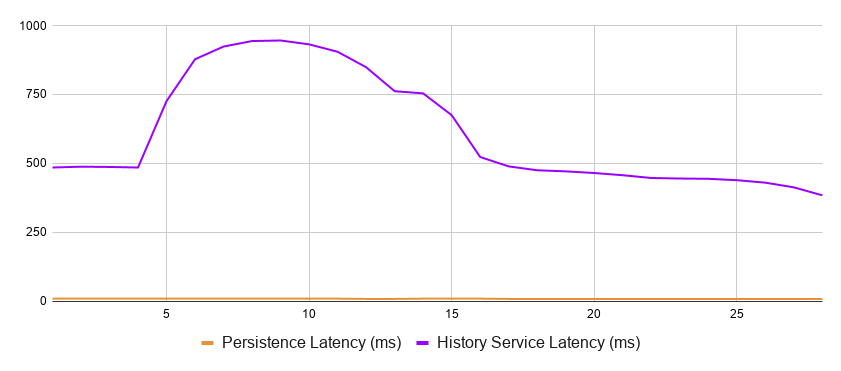
Database and service latencies for a single-shard configuration
Cassandra’s response time is very close to zero as compared to the History service response time. The vast majority of the latter is internal contention.
The CPU utilization reasonably fairly low too:
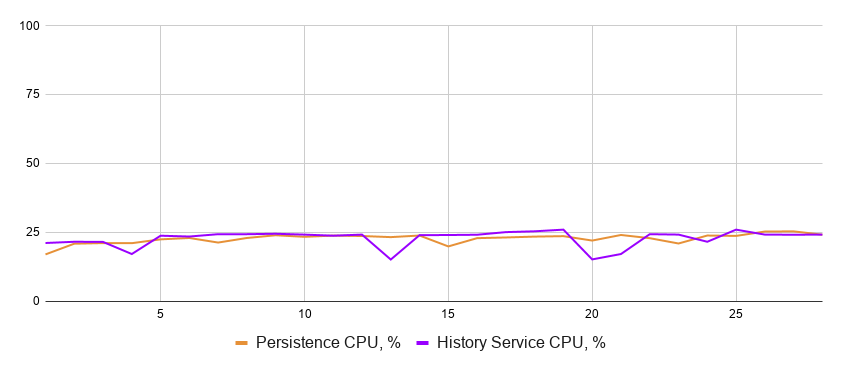
Database and service CPU usage for a single-shard configuration
Both the database and the service are underutilized, as the cluster spends the majority of time waiting.
Increasing the Number of Shards
I re-ran the exact same experiment with 4, 8, 64, 512, and 4096 shards and correlated the shard number with the key metrics. Note that the horizontal axis is out of scale on all the charts below.
The processing time goes down as the number of shards grows:
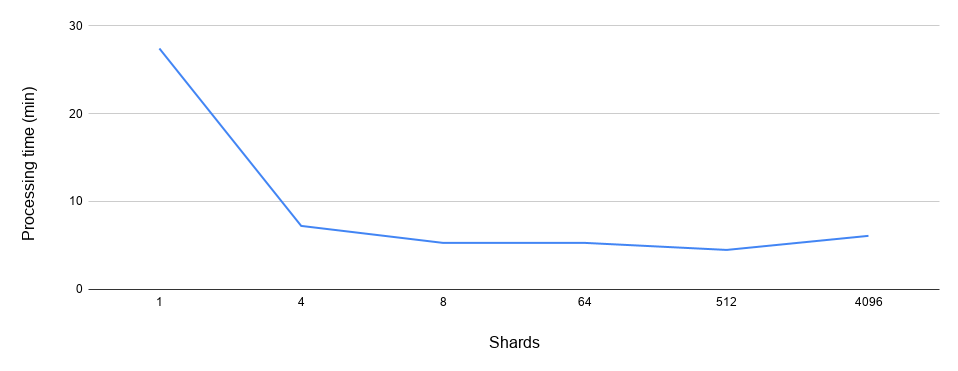
Total time to process the workflows as a function of the number of shards
The History service latency gets closer and closer to the persistence latency as the former decreases and the latter increases due to a higher load:
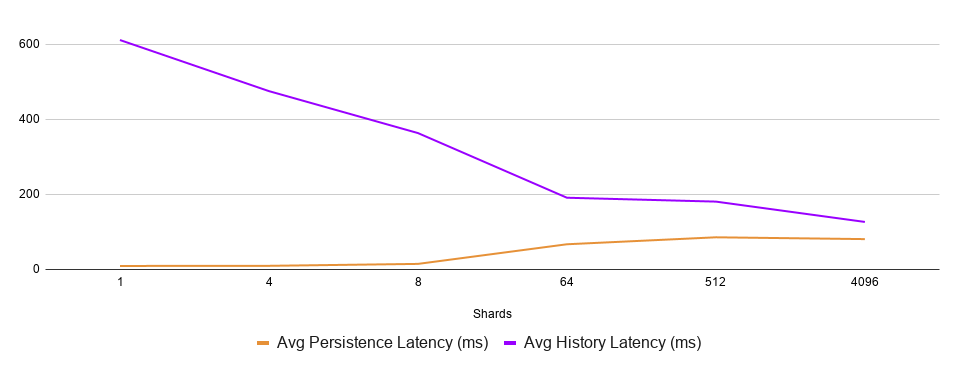
Database and service latencies as functions of the number of shards
The CPU utilization is pretty good for all experiments with 8 or more shards.
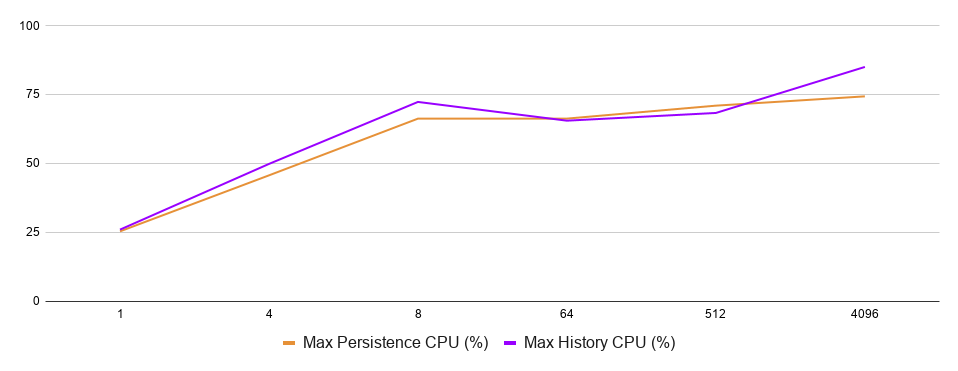
Database and service CPU usage as functions of the number of shards
Adding more and more shards has diminishing returns: the difference between 1 and 4 or 4 and 8 is much more pronounced than 8 to 64 or 512 to 4096. However, it still looks like more shards are universally better than fewer shards. Would it be reasonable to set the shard number to an arbitrarily large number and be done with it?
Too Many Shards
Can there be too many shards?
Yes. Each shard consumes resources of History service pods and performs some background processing on the database. So, the system pays an overhead fee for each additional shard. Also, an excessive number of shards slows down node recovery as each shard has to load its state from the database on redistribution after a service host goes down.
The next chart shows the distribution of memory consumption of the History service host across all experiments.
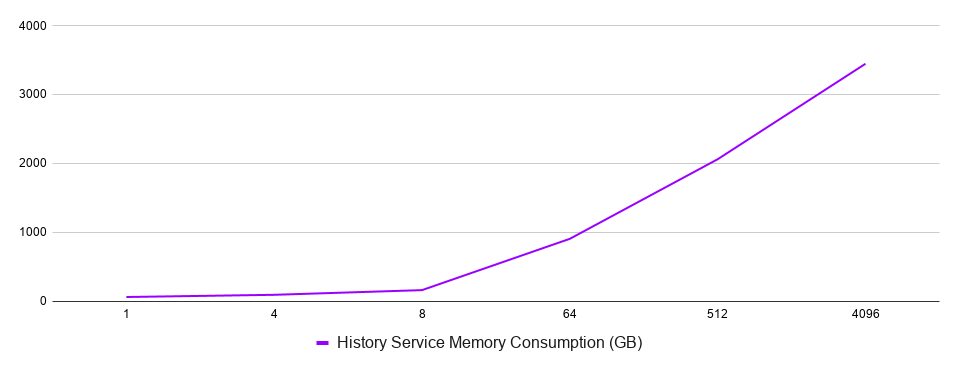
Service memory consumption as functions of the number of shards
In fact, I tried running the experiment with 32.768 shards, but it utterly failed because the History service pod consumed too much memory, and the controller kept evicting it.
Conclusions
The shard number of the History service is a critical configuration of a Temporal cluster. The configured value has a direct impact on throughput, latency, and resource utilization of the system.
It’s essential to get this configuration right for your setup and your performance targets. Even more so because the value can’t be changed after the initial cluster deployment.
Maru is a performance testing tool that can help you determine the optimal configuration value empirically. You can use Maru to run multiple experiments with your cluster and application code, collect the results, and decide before going into production. The data in this article was collected with Maru.

Responses